


Today’s review is separated into three parts:
- Performance of the hardware (clock speeds, temperatures, and power draw).
- Raw frame rate results from typical game rasterization benchmarks.
- Summary, conclusion, and recommendations.
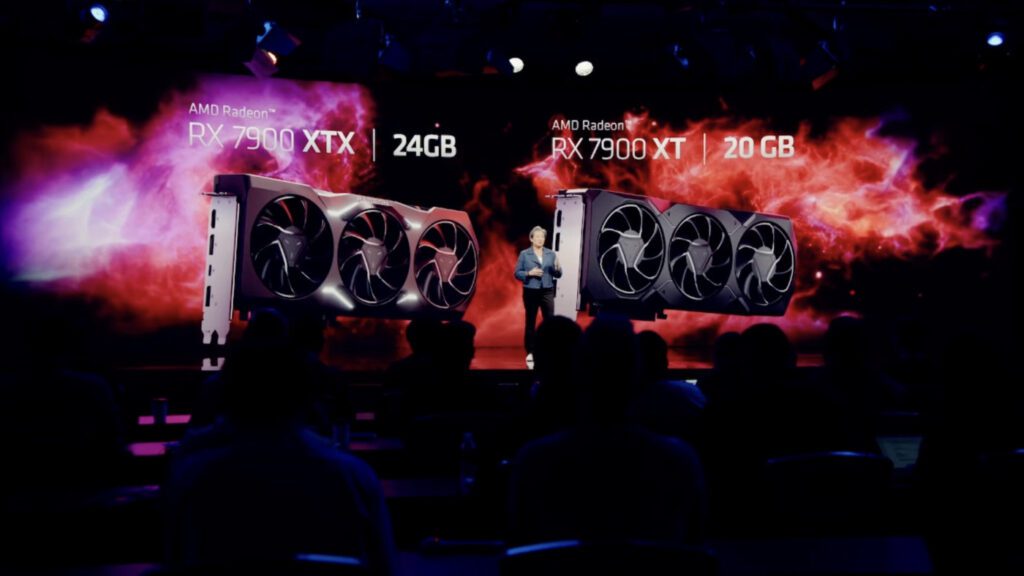
Today we are comparing RX 7900 XTX and RX 7900 XT to a stacked deck of the most powerful video cards in the world.
This review is brought to you by Paul’s Hardware, check out his channel for the latest tech news and reviews.
Using the NVIDIA founder’s edition cards for Team Green wherever possible, we have the RTX 4090 and RTX 4080 from the 40 series and the RTX 3090, RTX 3080 TI, and RTX 3080.
The RTX 3090 TI is represented by the manufacturer-overclocked MSI Supreme X.
From Team Red, we have their former top GPUs, the RX 6950 XT, represented by the Gigabyte Gaming OC 16G, and lastly, the RX 6900 XT in AMD reference design trim.
Design Specs
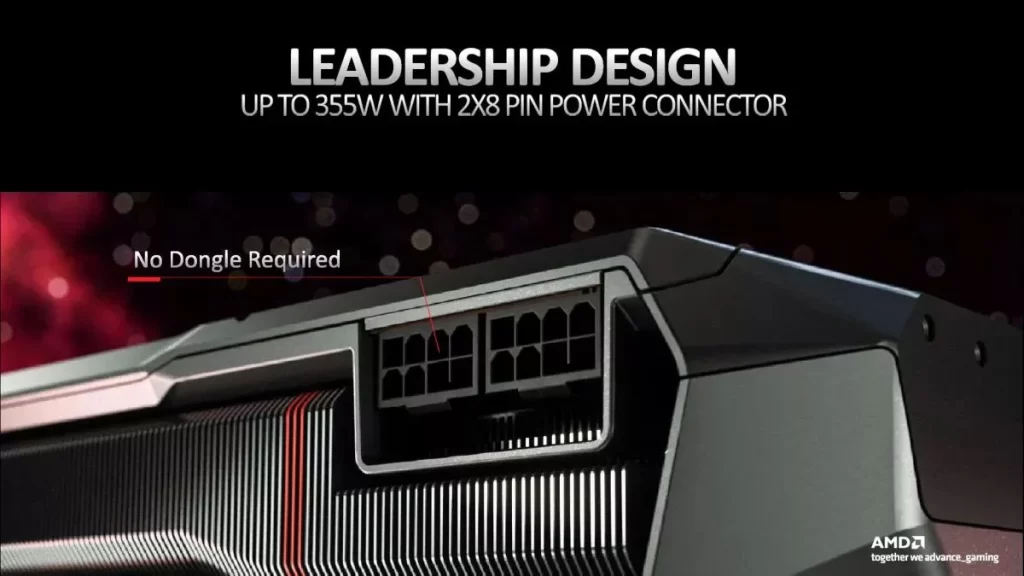
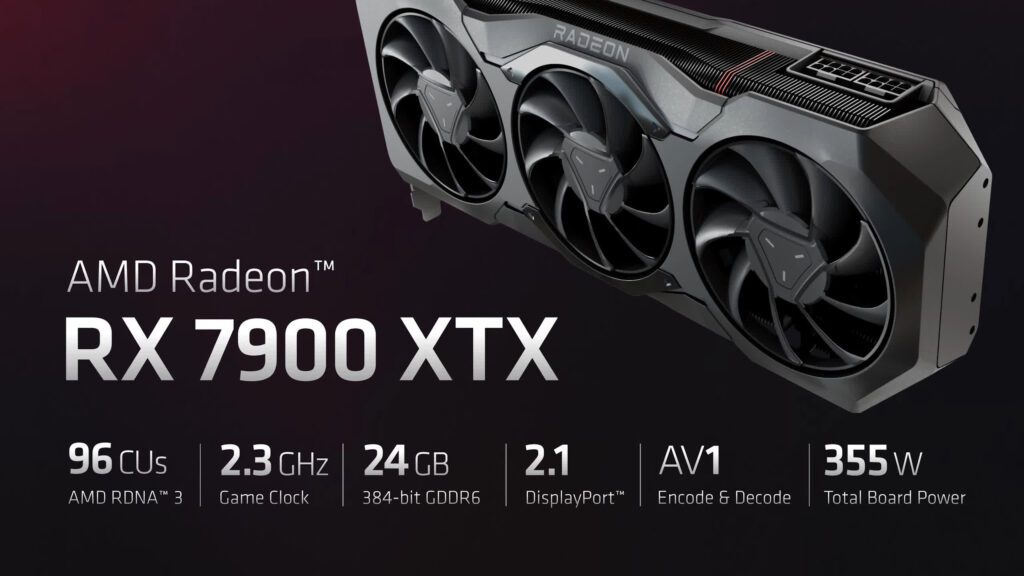
The XTX has a 355-watt TDP, and the XT was bumped to 315 watts from the initially announced a spec of 300 watts. The power supply requirements did not change.
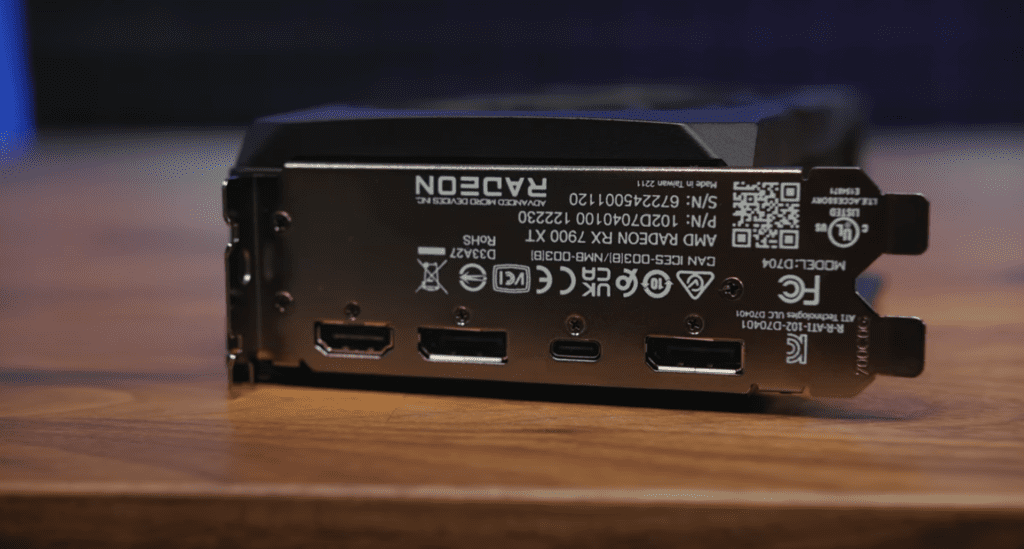
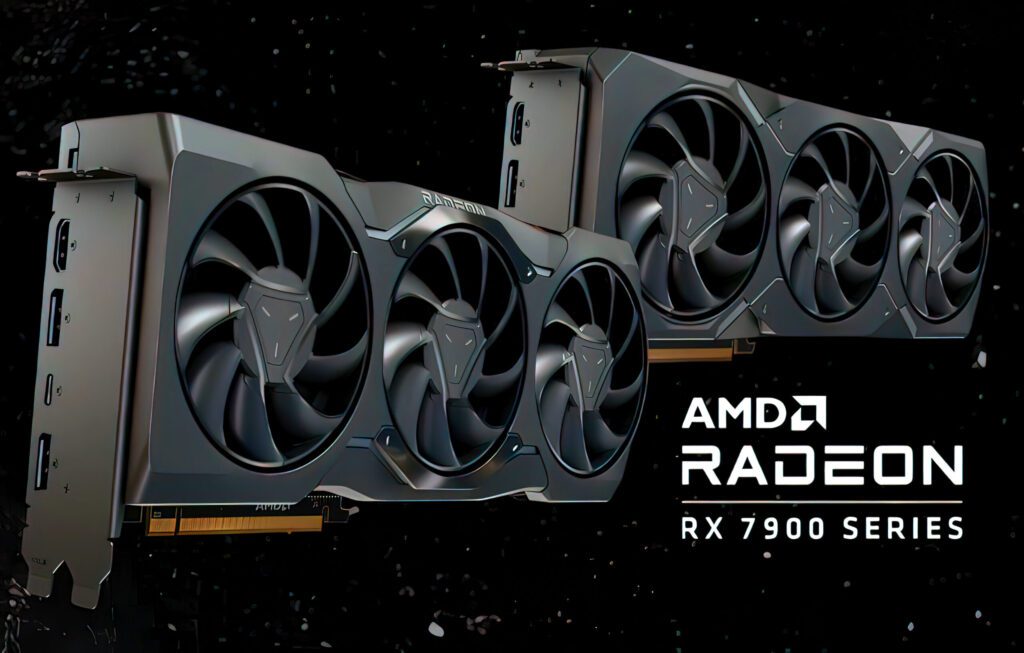
AMD recommends an 850-watt power supply at minimum for the XTX and 800 watts for the XT. The cards both require two eight-pin PCI express graphics power connectors. For video outs, there’s one HDMI 2.1 and two display port 2.1 connectors (not display port 1.4a, mind you), as well as a single USB type C plug meant for VR headsets that can also output a display port video signal via a sold separately adapter.
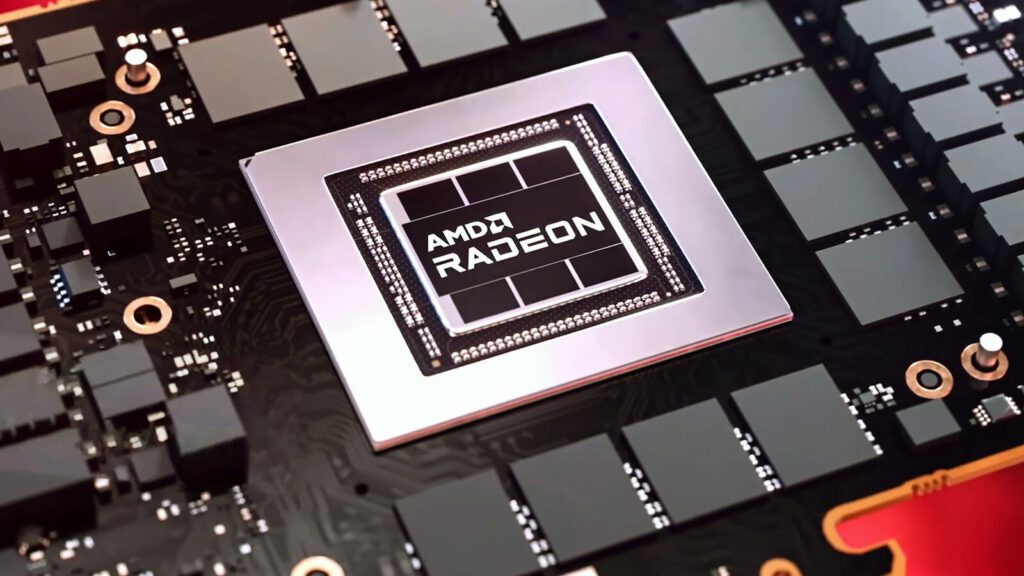
The GP uses the first ever MCM, or Multichip module designed for consumers, featuring a larger graphics compute dye built on TSMC’S five-nanometer process and much smaller MCDs or memory cash dyes based on TSMC six nanometer.
For the infinity cash and memory controllers, the XTX uses six MCDs, and the XT uses five, with one dummy M CD filling the final spot for that GPU. Using smaller chits should allow AMD to achieve better yields in manufacturing so they can keep costs down. In theory, at least the remaining stats for the cards can be seen here for the Radeon GPUs, particularly when compared to the Radeon 6,000 series.
You can see significant boosts in raw compute performance with up to 61 plus tariff flops for the 7900 XTX and significant increases in memory bandwidth even with GDR six non-X VRA thanks to the 384-bit and 320-bit buses. Also note that AMD lowered the launch price of these cards versus the last gen by about $100, which is contrasted heavily as we look at NVIDIA’s GPU stats, where they were kind enough to tack on a $500 premium going from the RTX 3080 to the RTX 4080.
AMD Radeon RX 7900 Series “Official” Specifications:
| GRAPHICS CARD | AMD RADEON RX 7900 XTX | AMD RADEON RX 7900 XT | AMD RADEON RX 6950 XT | AMD RADEON RX 6900 XT |
|---|---|---|---|---|
| GPU | Navi 31 XTX | Navi 31 XT | Navi 21 KXTX | Navi 21 XTX |
| Process Node | 5nm+6nm | 5nm+6nm | 7nm | 7nm |
| Die Size | 300mm2 (Only GCD) 522mm2 (with MCDs) | 300mm2 (Only GCD) 522mm2 (with MCDs) | 520mm2 | 520mm2 |
| Transistors | 58 Billion | 58 Billion | 26.8 Billion | 26.8 Billion |
| GPU WGPs | 48 | 42 | 40 | 40 |
| Stream Processors | 6144 | 5376 | 5120 | 5120 |
| TMUs/ROPs | 384 / 192 | 384 / 192 | 320 / 128 | 320 / 128 |
| Game Clock | 2.3 GHz | 2.0 GHz | 2100 MHz | 2015 MHz |
| Boost Clock | 2.5 GHz | 2.4 GHz | 2310 MHz | 2250 MHz |
| FP32 TFLOPs | 61 TFLOPs | 52 TFLOPs | 23.65 TFLOPs | 23.04 TFLOPs |
| Memory Size | 24 GB GDDR6 | 20 GB GDDR6 | 16 GB GDDR6 | 16 GB GDDR6 |
| Infinity Cache | 96 MB | 80 MB | 128 MB | 128 MB |
| Memory Bus | 384-bit | 320-bit | 256-bit | 256-bit |
| Memory Clock | 20 Gbps | 20 Gbps | 18 Gbps | 16 Gbps |
| Bandwidth | 960 GB/s | 800 GB/s | 576 GB/s | 512 GB/s |
| Effective Bandwidth | 3.5 TB/s | 3.5 TB/s | 1728.2 GB/s | 1664.2 GB/s |
| TBP | 355W | 315W | 335W | 300W |
| PCIe Interface | PCIe 4.0 x16 | PCIe 4.0 x16 | PCIe 4.0 x16 | PCIe 4.0 x16 |
| Price | $999 US | $899 US | $1099 US | $999 US |
Relevant stats for all the cards tested today are here if you want to compare them, and I’m showing current pricing, which has gone up a lot for NVIDIA in the past month based on the average of the cheapest two to three models available on PC part picker.
The Test Bench
All tests were run on this test system with:
- ROG Crosshair X670E Extreme motherboard
- AMD Ryzen 9 7950x 16-Core CPU
- Corsair 360 millimeter AIO Cooler
- 32GB G.Skill DDR5 Trident Z5 6000MHz CL30 Memory Kit
- Corsair AX1600i Digital ATX Power Supply
- Windows 11, version 21 H2
Performance
Clock Speeds
There was rumored concern about clock speeds for these GPUs and whether they would get past three gigahertz, but it was for naught.
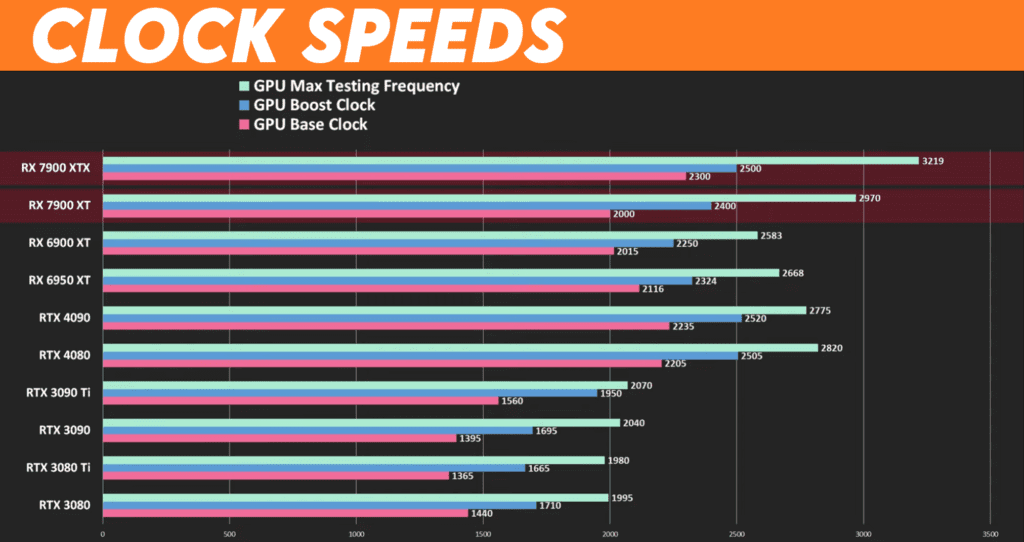
The RX 7900 XT and XTX have game and boost clock specs listed by AMD, and as has become the standard, the cards boost well beyond the advertised clock speeds in practice hitting 3,219 megahertz peak for the XTX and 2,970 megahertz for the XT.
Temperatures
Here are the peak GPU core and memory temperatures.
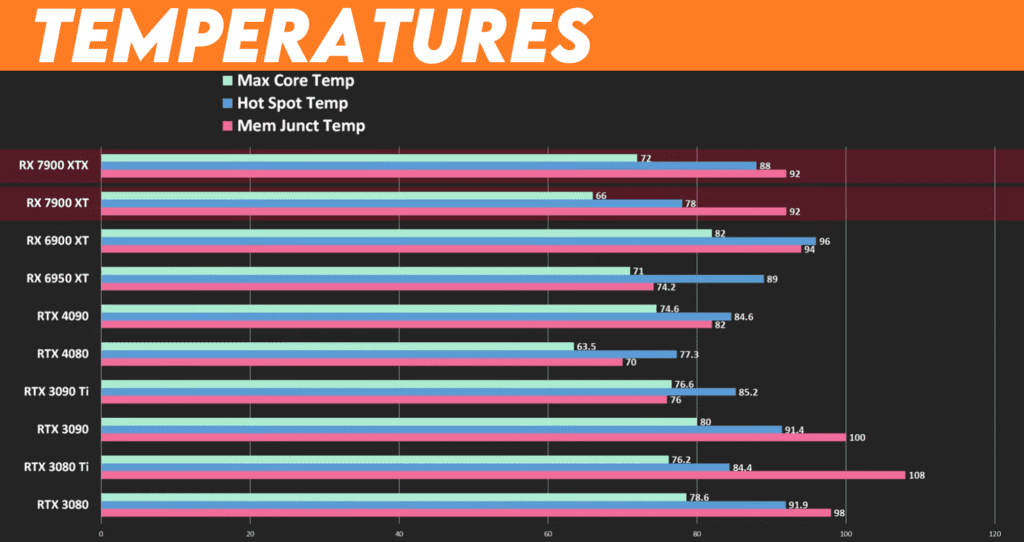
There are several ways to interpret this data. First, for many ITX system builders, the XT and XTX are 2.5 slot GPUs that maintained reasonable temperatures with core temps only in the high sixties to low seventies.
The 4080, 4090, and 6950 XT are in the same range, albeit with lower VRA temps. But remember that my 6950 XT is an aftermarket card with a large cooler, and the NVIDIA 40 series FE cards also use powerful cooling solutions.
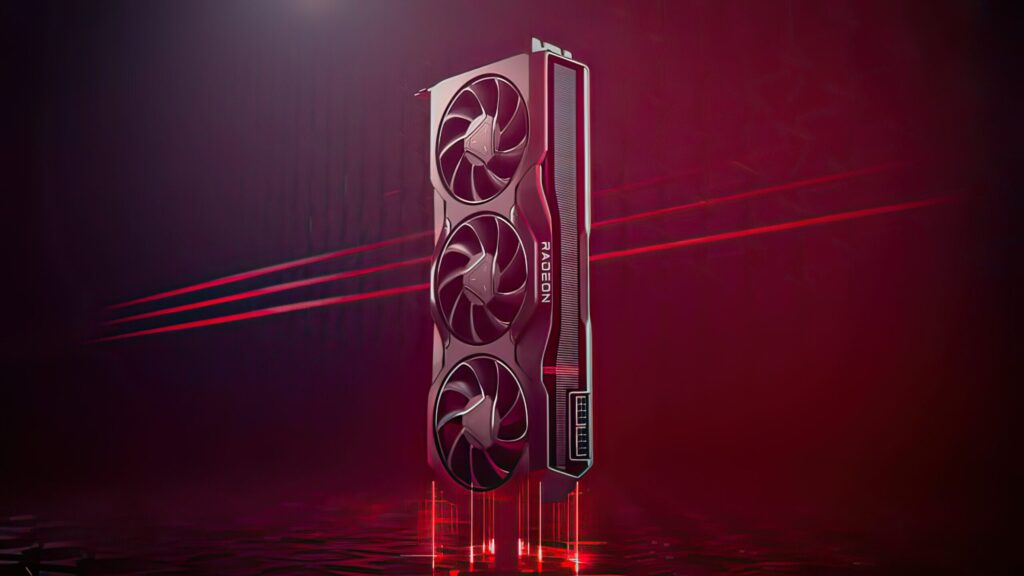
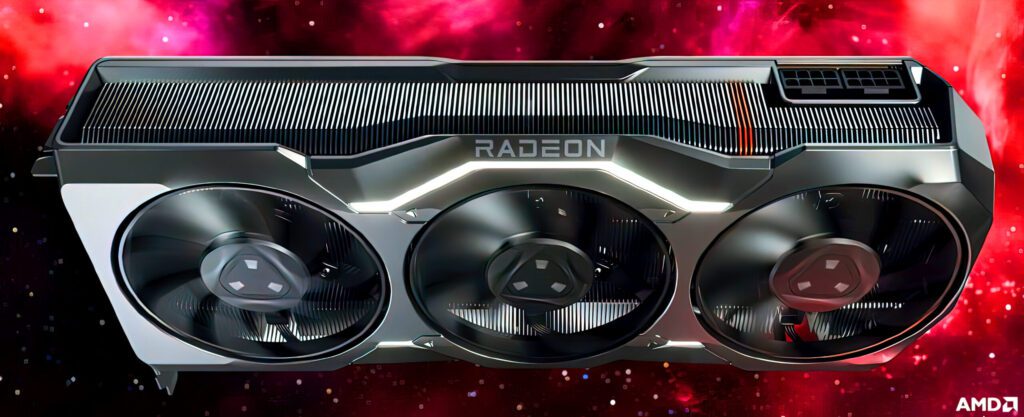
The VRAM temps for the RX 7900 s could be better, but overall, AMD succeeded in making some visually appealing and quite capable coolers to keep the thermals in check.
Power Draw
Let’s round this part out with my power draw numbers.
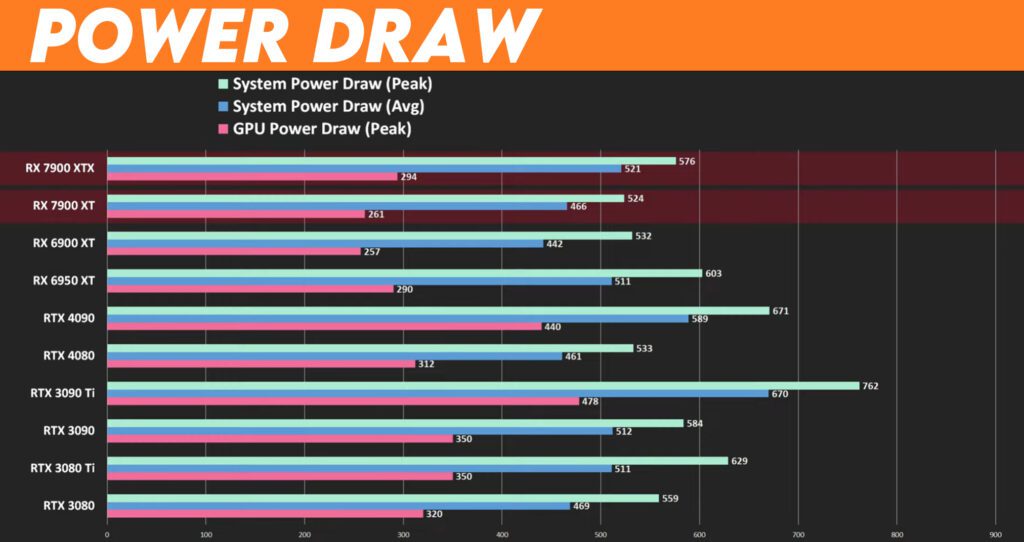
It’s another good result for AMD. These GPUs are not Power Hogs 466 watts average system power draw for the 7900 XT under load and 521 for the 7900 XTX is not the lowest on this chart, but it’s only a modest 10 to 20 wat bump over the 6000 series while also achieving much better performance.
As you’ll see soon, the 7900 XT was very close to the RTX 4080 in terms of peak and average draw, and thankfully, none of these cards got up to 3090 Ti territory.
Rasterization Benchmarks
And now, it is time for traditional rasterization benchmarks at 4K, 1440p, and 1080p.
These 3D mark tests are synthetic benchmarks, so they are not included in my overall benchmark results.
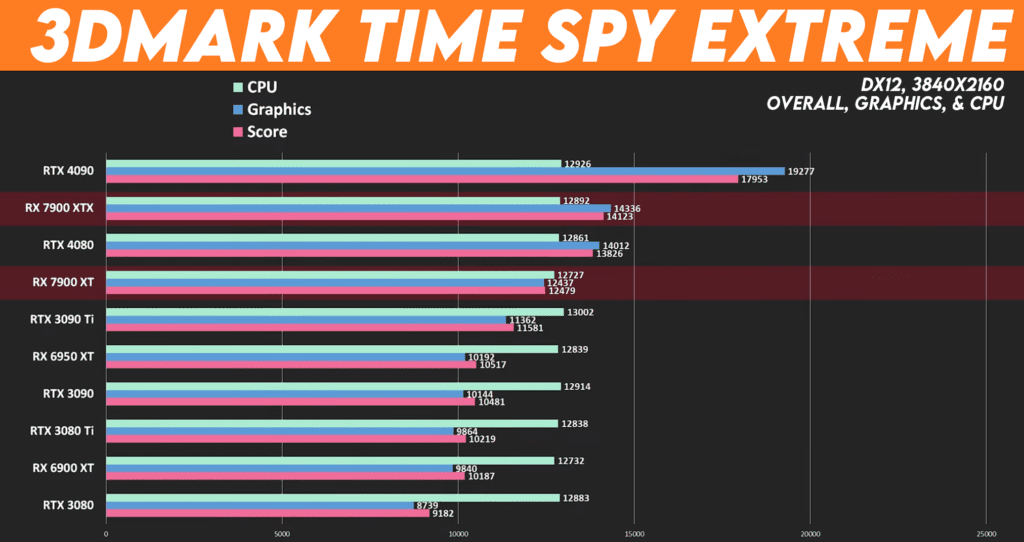
3DMark Time Spy Extreme is first, which is a 4K test, and a graphic score of 14,336 gives the $1,000 RX 7900 XTX the Edge over the $1,200 RTX 4080, the XT hit 12,437, a decent step back from the XTX, but still enough to beat the 3090.
3D Mark Port Royal is next, so we can get a general idea of how these cards handle Ray tracing.
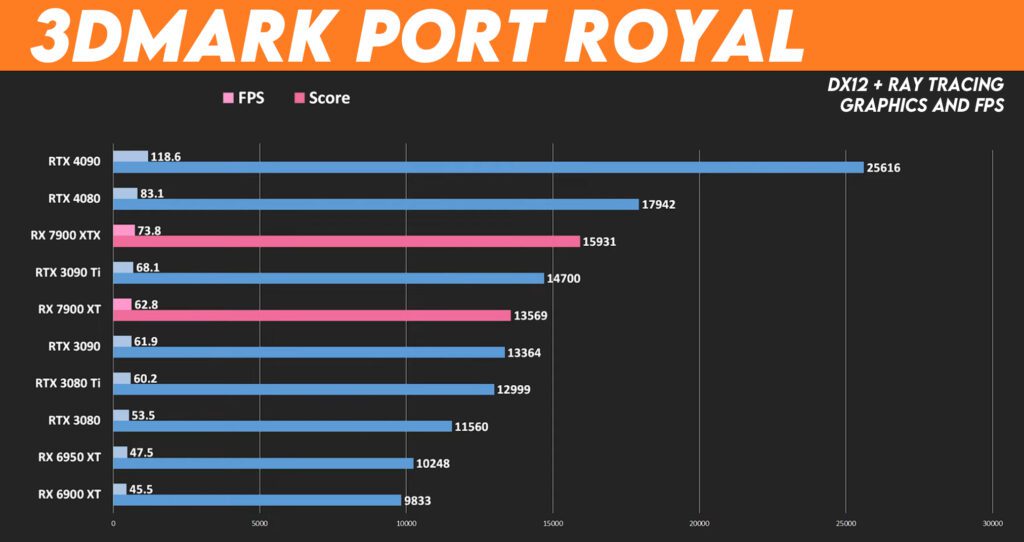
Formerly Radeon GPUs sucked at ray tracing, and while these Port Royal results won’t necessarily carry over linearly to every game with ray tracing support, since there are many ways the technology can be implemented, it is nice to see such a big jump from the 6900 XT and 6950 XT.
Specifically, the 7900 XT was 32% faster than the 6950 XT here and the XTX was 55% faster. That said, both of AMDs new cards are still lagging behind the new Nvidia cards.
Game Tests
Moving on to real worlds games, we have a lot of DX12 titles.
Far Cry 6 Benchmarks
We will look at Far Cry 6 at 4k resolution and 1440p and 1080p.
Far Cry 6 at 4k Resolution
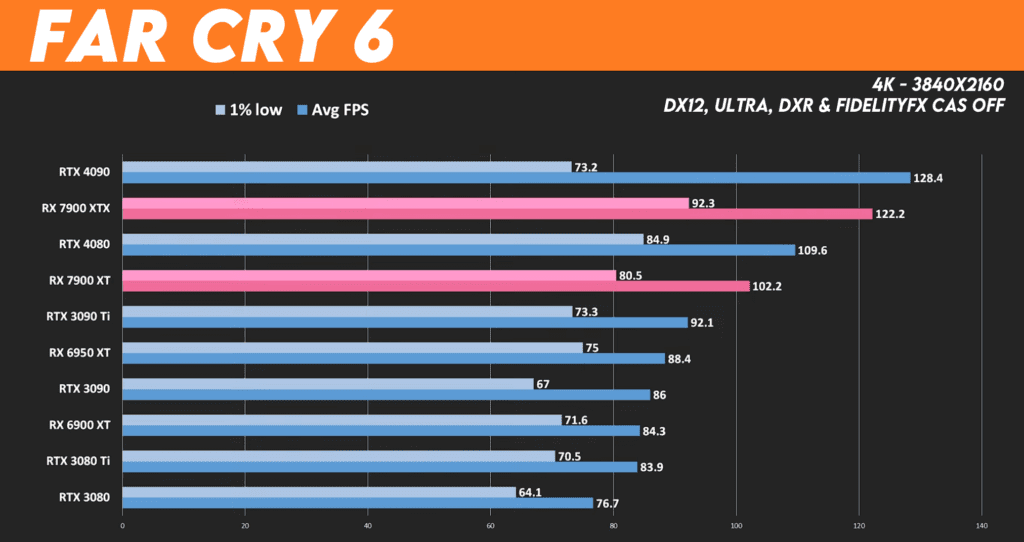
Based on rumors, the XT and XTX slot into the spots we somewhat expected them to, with the XTX beating the 4080 and the XT coming up just short, hitting 102.2 FPSs on average about 7% behind, although it still surpassed the 3090 TI.
Whenever the 7900 XT is in the same ballpark as the 4080 or the 3090 Ti, though, remind yourself that at 900 bucks, it costs at least 25% less than those more pricey Nvidia offerings.
Far Cry 6 at 1440p
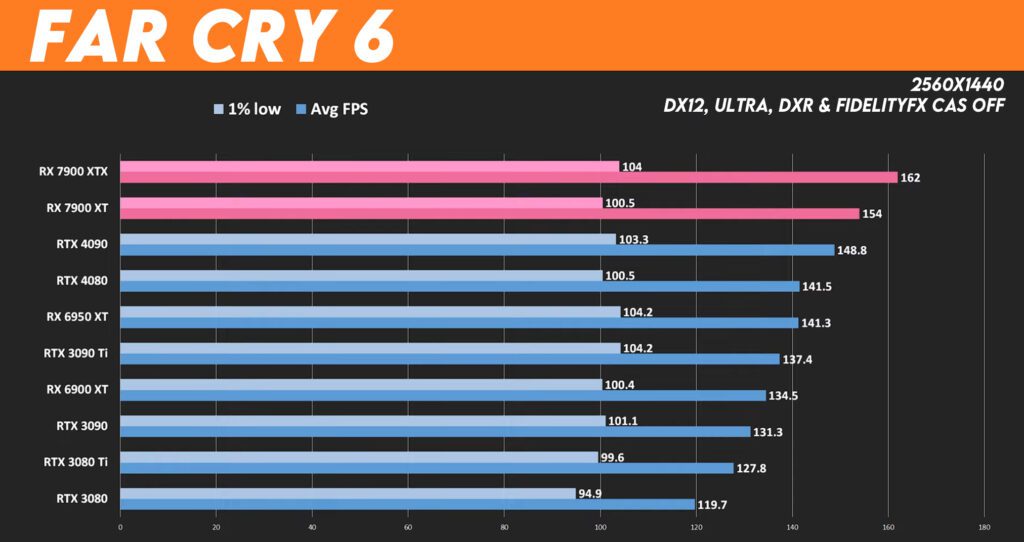
At 1440, we begin to hit CPU limitations, but another trend will continue to play out. The 4080 and 4090 are tough to beat at 4k, but the Radeon XT and XTX cards come back at lower resolutions.
They are 3.5% and 9% ahead of the 4090, respectively.
Far Cry 6 at 1080p
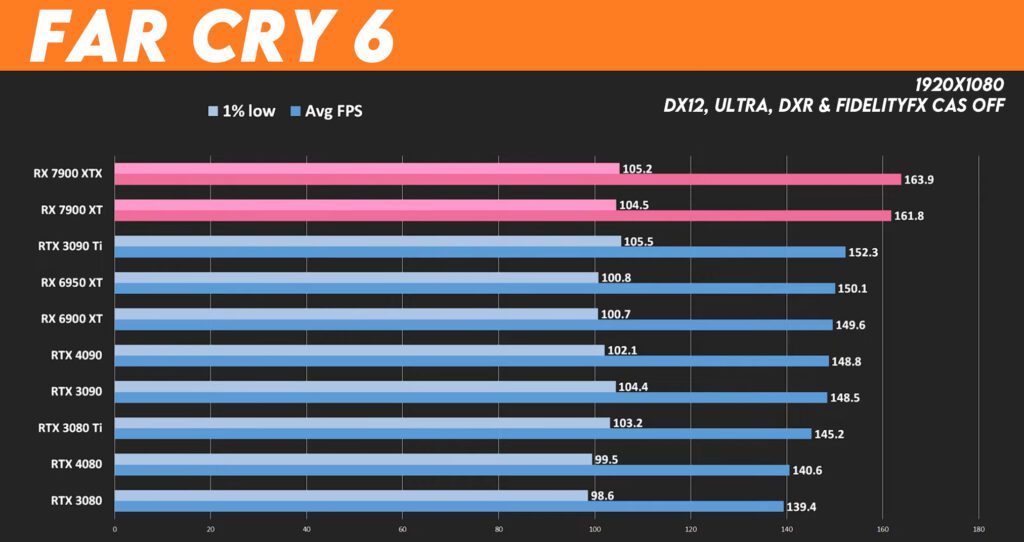
At 1080p, we are almost entirely CPU-bound, but the new GPUs from AMD still managed a 9% and 10% uplift versus the 4090.
Shadow of the Tomb Raider Benchmarks
Next, we have Shadow of the Tomb Raider, and at 4k, we look more directly at each card’s performance, whereas at 1440 and 1080 CPU limitations begin to even things out.
Shadow of the Tomb Raider 4k Benchmarks
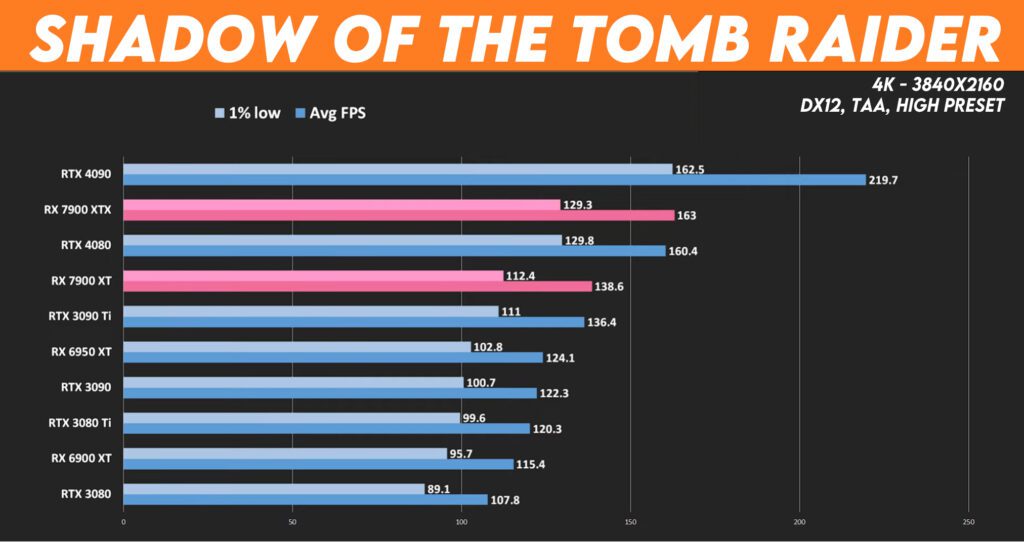
At 163 FPS on average, the RX 7900 XTX is neck and neck with the RTX 4080. While the 7900 XT is about 14% slower at 138.6 FPS.
Shadow of the Tomb Raider 1440p Benchmarks
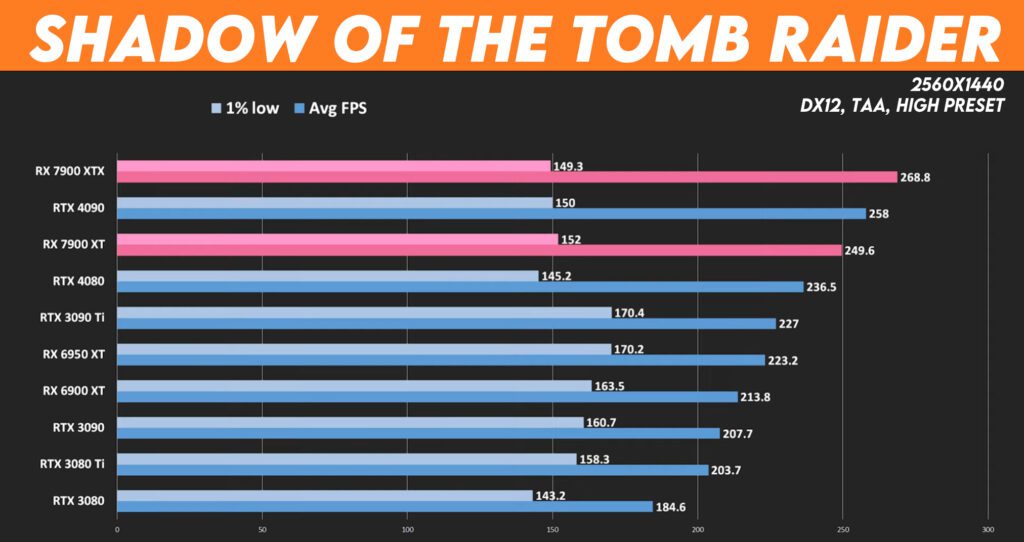
At 1440, both Radeon cards jumped up in the charts again, with the 7900 XTX beating the 4090 by 4.2%. The 7900 XT also surpassed the RTX 4080 by a modest 5.5% margin.
Although all the top cards suffered from slightly reduced 1% lows versus the rest of the pack.
Shadow of the Tomb Raider 1080p Benchmarks
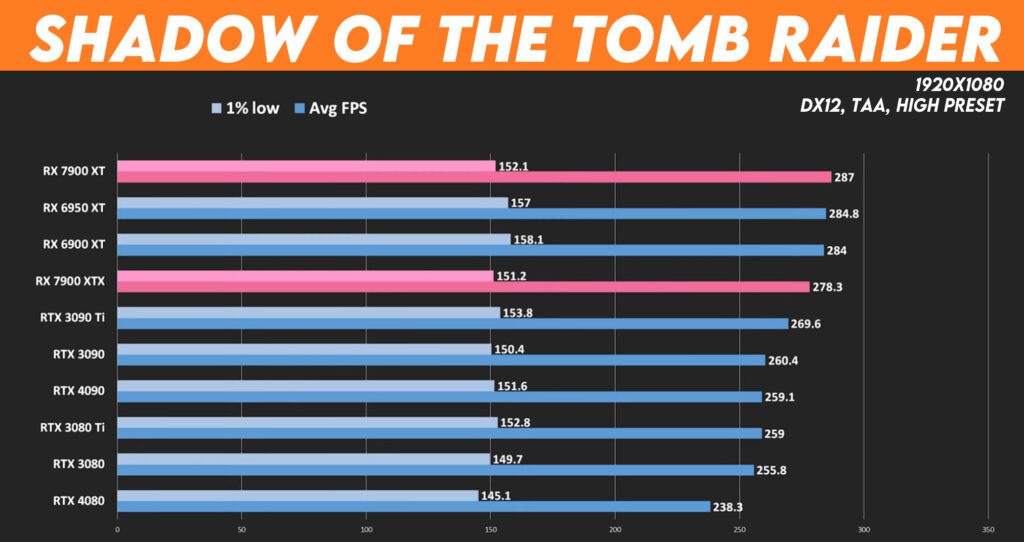
At 1080p, we are CPU bound again, and in this test, all the Radeon cards managed to surpass the competition by 20 to 40 frames per second.
Cyberpunk 2077 Benchmarks
Cyberpunk 2077 is running with the Ultra Graphics preset, which presented the 7900s with a challenge.
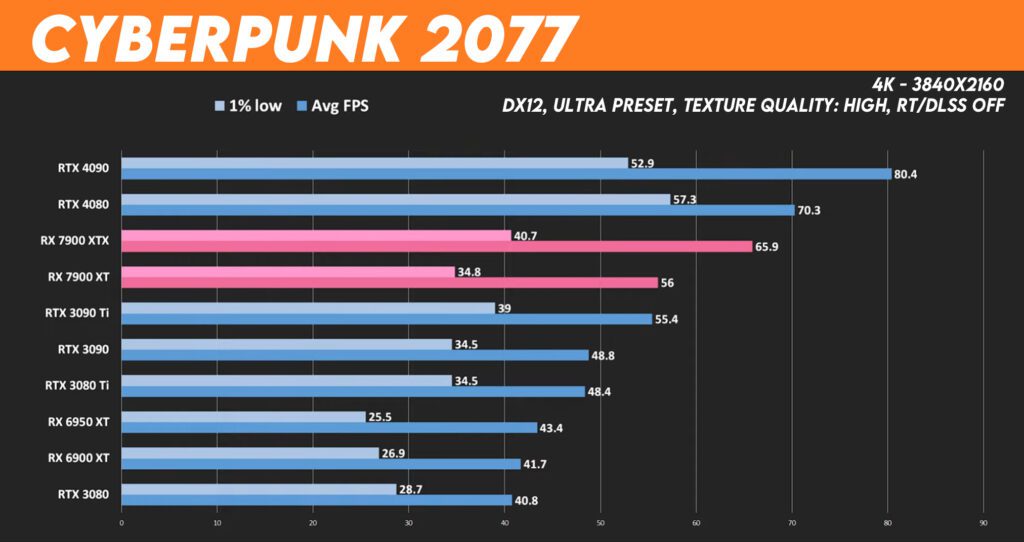
Cyberpunk 2077 4k Benchmarks
This is one of the poorer-performing titles for Team Red.
Cyberpunk 2077 1440p Benchmarks
While there are significant improvements over the Radeon 6000 series cards, NVIDIA still maintains a significant lead, particularly if you’re factoring 1% low performance into the equation at 1440p.
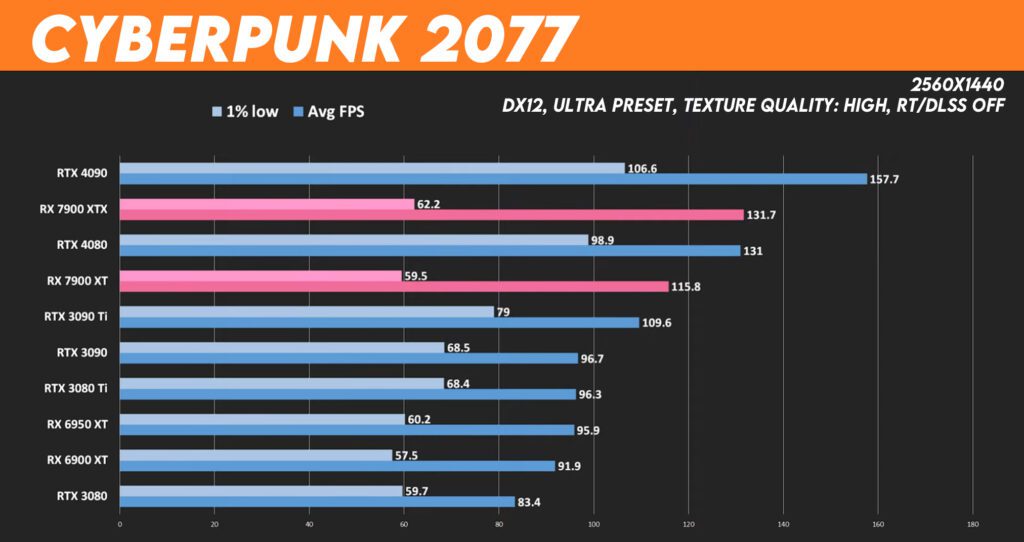
The 7900 claw backed some performance slotting above and below the RTX 4080 on average, but the 1% lows were quite spotty and led to some noticeable hiccups while testing.
Cyberpunk 2077 1080p Benchmarks
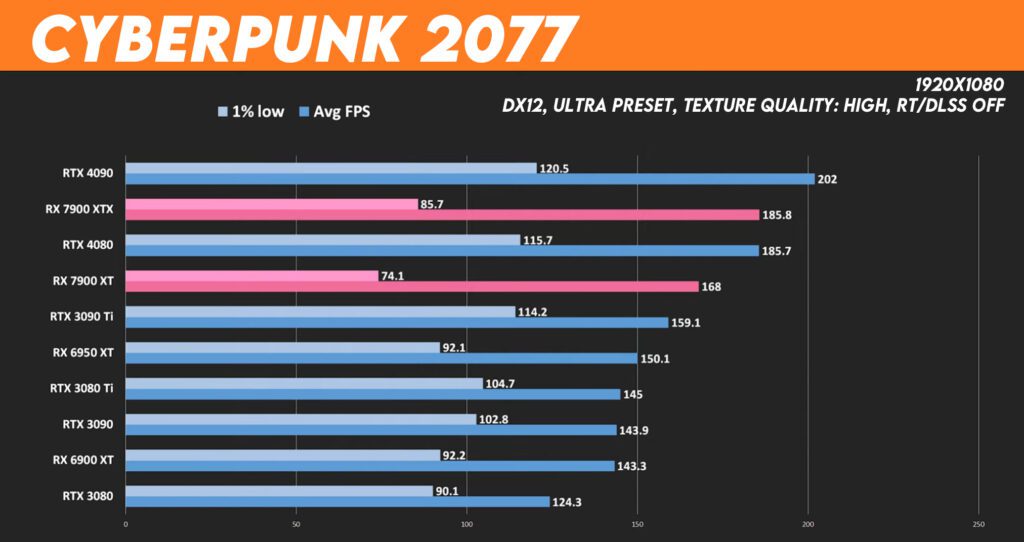
And at 1080p, we are hitting CPU limitations again, with those 1% lows hampering the XT and XTX’s overall performance.
Hopefully, a driver update can smooth those out in the future.
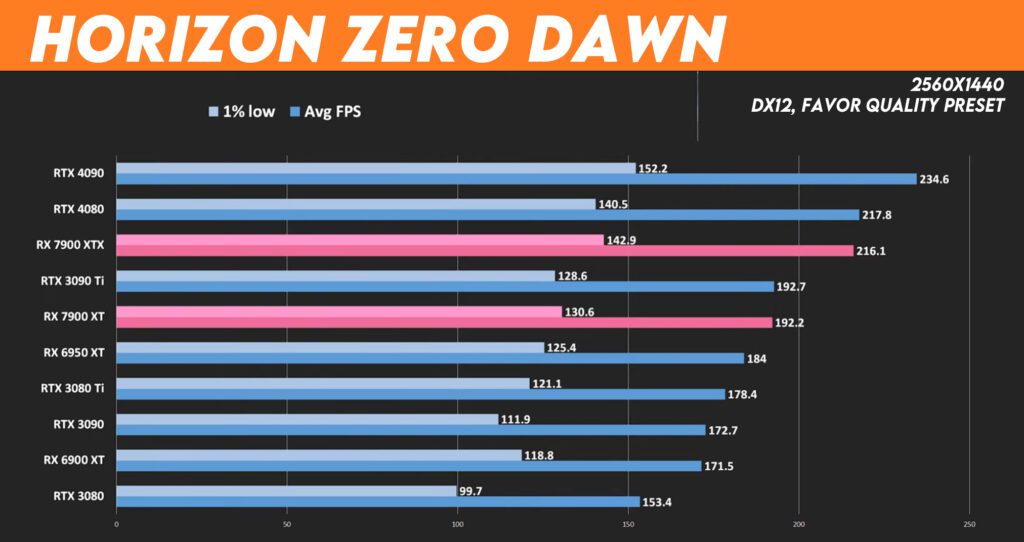
Horizon Zero Dawn Benchmarks
Here’s Horizon zero dawn using the favorite quality preset, and this is another title where the 4080 and 4090 shine at 4k.
Horizon Zero Dawn 4k Benchmarks
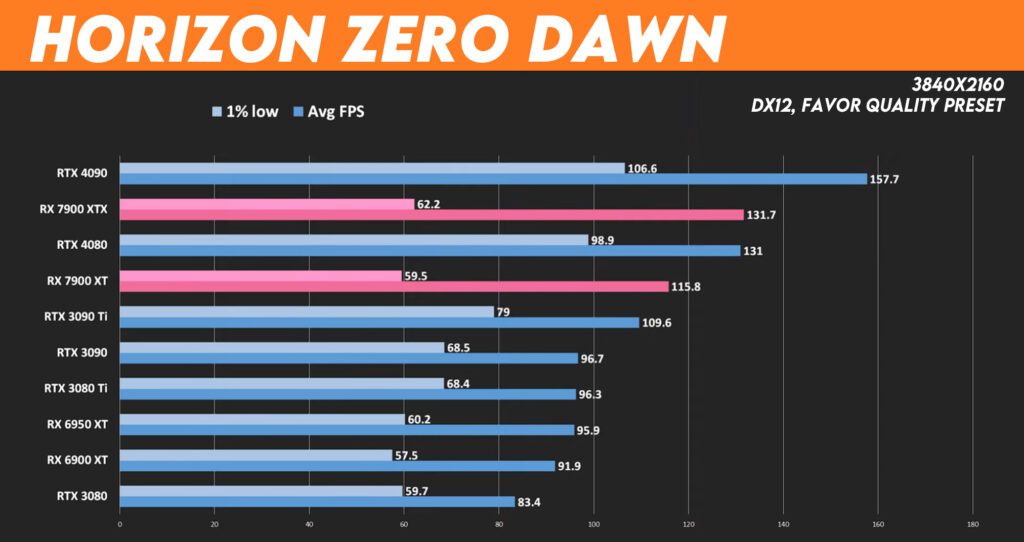
The 7900 XTX couldn’t beat the 4080 here and was 2% behind. While the 7900 XT was slower by about 17%.
Horizon Zero Dawn 1440p Benchmarks
The lead was reduced at 1440p, with the 4080s 218 FPS being 0.8% ahead of the 7900 XTX and 12% ahead of the 7900 XT.
Horizon Zero Dawn 1080p Benchmarks
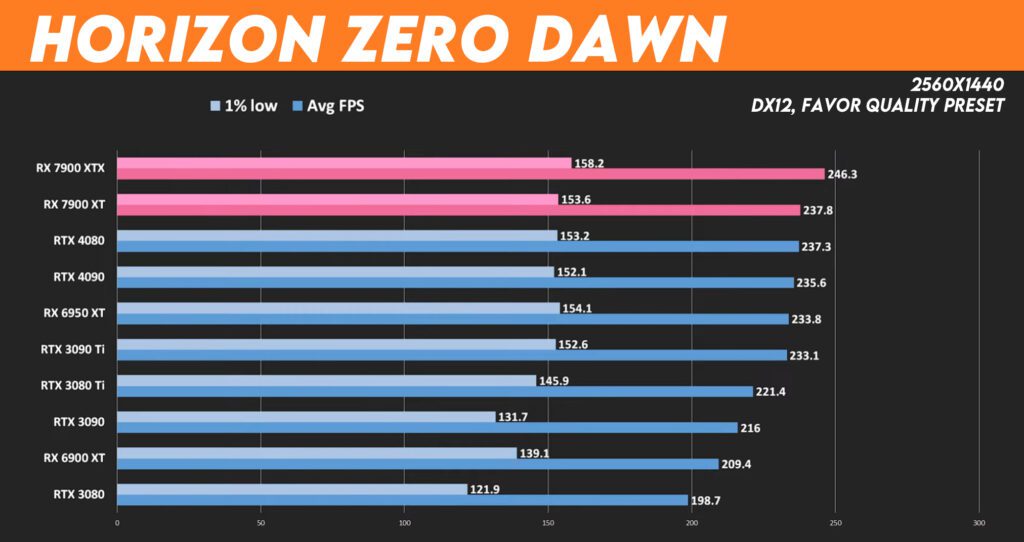
At 1080p the 7900s do that thing where they edge out the other cards in CPU-limited scenarios, taking the number one and two spots by between 2 and 10 frames per second.
Dirt 5 Benchmarks
Dirt 5 4k Benchmarks
We’re running the ultra-high preset at 4k got us 152 FPSs out of the RX 7900 XTX, another 11% victory versus the 4080, which also puts it 21% slower than the 4090.
Dirt 5 1440p Benchmarks
The XT was also very close to the 4080 again, at 1440. The RTX 4080 is much closer to the XTX while also staying 9% ahead of the 7900 XT.
The 4090 takes an even bigger lead, hitting 287.5 FPS, which puts the XTX 23% behind.
Dirt 5 1080p Benchmarks
At 1080 the margins shrink slightly. The 7900 XTX maintains less than a one-frame lead over the RTX 4080, while the 7900 XT is about 10% behind.
Resident Evil Village Benchmarks
Next is Resident Evil Village, another DirectX 12 game that is generally spooky.
The 7900 XTX pushed 181 FPSs at 4K for another 12% win over the 4080 while staying 18% behind the 4090.
In this game, Radeon GPUs are typically competitive with NVIDIA, and at 1440 they keep their position in the rankings without giving up too much ground.
And even here at 1080, the Radeon 7900 XT manages to beat out the RTX 4080 to take the three spot, while the XTX nestles in just 3.5 frames behind the 4090 on average.
Doom Eternal Benchmarks
Doom Eternal is my only Vulcan title, and it features squishy demons and high frame rates.
Starting at 4k, we see these 7900s struggling again with less than optimal 1% lows and results that drop below the 4080 and 3090 TI, respectively. This is a continuation of the RX 6000 series’ performance, which, while improved, leaves much to be desired.
At 1440 things improve, with the XT at 400 FPS and the XTX passing 450. Though maintaining a healthy lead, the RTX 4080 gets up to almost 500 frames per second.
We should note that the RTX 4080s display Port 1.4a output tops out at 240 hertz at 1440p while the DP 2.1 connector on the 7900 XT and XTX can push 1440p at 480 hertz.
And while those monitors might not exist yet, it’s good to know that these new Radeon cards will be ready for them when they do. And then at 1080, we see a mostly full recovery here for Team Red with the XTX at 585 frames per second and the XT at 536 back in their number two and four spots on the board with 1% lows in acceptable ranges as well.
Lastly, we have a couple of direct X 11 titles.
God of War (2018) Benchmarks
God of War, where I would like to highlight a flip-floppy shift in those 1% lows mentioned above. AMD has an edge in maintaining a smooth frame rate, with 7900 cards leading the pack in that metric. Averages keep the XTX and XT in their number two in four spots. But the trend continues at 1440p where more ground is gained by AMD, both on average and with the 1% lows.
The XTX is 8% slower than the 4090 here, and the XT is about 6% behind the 4080. However, at 1080p, the XT surpasses the 4080 by two frames, and the XTX is only about ten frames behind the 4090. While both cards again keep stutters and hiccups to a minimum with much improved 1% lows.
Microsoft Flight Simulator Benchmarks
Lastly, we have Microsoft Flight Simulator running in DX11 mode and exhibiting some of the worst CPU bottlenecking in my tests, although it is the least noticeable at 4k.
This game is a route of AMD. The 7900 XTX comes 16% behind the 4080 and is almost 25% slower than the 4090.
This is also a feature title for NVIDIA’s DLSS Frame Generation, which can get you significantly higher frame rates, particularly in a CPU-limited title like this one.
So MS Flight Sim enthusiasts will likely lean towards Nvidia cards, but let’s finish our results.
At 1440, we hit that CPU wall, and suddenly, none of the cards could get more than 80 FPSs. Even the 40 series cards struggle here. This results in a comeback for Team Red and some decent 1% low results as well.
At 1080p, the whole ranking system is upended, and the Radeon RX 6950 and 6900 XT pull up to take a win. This shows how higher resolutions like 4K and not CPU-limited games better show the actual performance differences between the GPUs.
But if I left this out of my spreadsheet, I would have a blank column that would drive me crazy.
Cumulative Benchmark Results
Okay, it’s time for my overall cumulative results.
I have evenly weighted my benchmark scores by game, and I’m using the fastest 6000 series card, the RX 6950 XT, as the 100% baseline to see how far AMD has come with their new GPUs.
Please note that these are sorted by the 4K results where GPU performance can be taken purely without the base alloy of CPU limitations.
But while the RTX 4080 does seem to edge out the RX 7900 XTX here, please note that the 1440 and 1080 performance is the opposite.
At lower resolution, the XTX is faster: 15.4% and 27.9% ahead of the 6950 XT versus 7.5% and 22.9% for the RTX 4080.
Likewise, the 7900 XT outperforms the 3090Ti at those lower resolutions while also getting edged out by less than 1% at 4k.
Pricing
But then we look at current pricing for these cards, and things look much uglier for Nvidia, at least if you’re a consumer concerned with value.
NVIDIA’s competition for these cards by price in the $900 to $1,000 range right now is the RTX 3080 Ti, which is $975 for the cheapest version. However, most were going for well over $1,000.
That card offers something like 15% to 40% less performance versus the 7900 XT or 7900 XTX.
The rest of NVIDIA’s cards, RTX 3090 and up are 20% to 60% more expensive. And to see significant gains versus these cards, you’d have to opt for the RTX 4090, which starts at $1600 bucks and is also pretty tough to find in stock right now.
Most are going for $1800 to $2000 or more.
Of course, AMD might deal with its own stock issues for these cards in the coming days. It’s still too early to tell.
Conclusion
One company has done a stellar job marketing AMD’s new $900-1,000 graphics cards to us: Nvidia.
By keeping not just a solitary Titan class or 90Ti branded GPU in that Halo pricing tier over $1000. Instead, it feels like half of the Nvidia product stack going down to the 3080 ti costs that much.
Nvidia seems committed to anchoring the value of their GPUs in a price range that many gamers can’t afford.
That allows AMD to come along and say, “Hey guys, check out our $1,000 graphics cards. They are a better value than the competition, and they’re right, at least for gamers who don’t primarily play flight simulators.”
But these remain expensive GPUs, and we should remember that just because they’re not $1,200 or $2000.
On the plus side, though, the performance of the RX 7900 XT and XTX was excellent. Almost across the board, the coolers performed well while looking quite lovely to boot, and the power draw was within reason for GPUs of this caliber.
I hope that AMD’s chip manufacturing techniques, combined with their track record of reducing the prices of their GPUs over time, will lead to some eventual fire sales on these cards.
The mid-range needs more powerful and affordable GPUs that don’t cost as much as most gamers’ entire systems.
But there it is. Hopefully, that gave you a better idea of how the Radeon RX 7900 XT and RX 7900 XTX graphics cards stack up.
AMD should find a lot of interested buyers for these cards if they can keep them in stock and avoid ridiculously overpriced AIB partner cards.
Radeon RX 7900 XTX Review
Summary
The performance of the RX 7900 XT and XTX was excellent in particular for rasterization. However, ray tracing still lags Nvidias offerings. Almost across the board, the coolers performed well while looking quite lovely to boot, and power draw was within reason for GPUs of this caliber. Finally, let’s not forget, these are still very pricy cards, albeit less so compared to the 4080 and 4090.